
Implementing a Kalman Filter-Based Trading Strategy
Harnessing the Power of Kalman Filters for Smarter Trading Decisions

Financial markets are inherently noisy and unpredictable, making it challenging for traders and investors to identify and capitalize on profitable opportunities. To navigate this complexity, traders employ various mathematical and statistical techniques to filter out the noise and better understand the underlying trends in the data. One such powerful tool is the Kalman Filter, an algorithm designed for recursive estimation of the state of a dynamic system from noisy measurements.
Originally developed by Rudolf E. Kalman in 1960, the Kalman Filter has found applications in numerous fields, including engineering, navigation, robotics, and finance. In finance, it is particularly useful for predicting time series data, such as stock prices, which are influenced by a combination of trends and random fluctuations. By applying the Kalman Filter, traders can estimate the true value of a stock, smooth out short-term volatility, and make more informed trading decisions.
In this post, we will delve into the Kalman Filter and explore its application in developing a robust trading strategy. We will start with a brief overview of the Kalman Filter and its principles. Then, we will outline the trading strategy that leverages the Kalman Filter to generate trading signals based on the stock's price deviations from its estimated moving average. Finally, we will provide a detailed Python implementation of the strategy, complete with explanations and visualizations.
What is the Kalman Filter?
The Kalman Filter is a recursive algorithm that provides estimates of the true state of a system based on a series of noisy observations. It operates in two main steps: prediction and update.
Prediction Step: In this step, the Kalman Filter uses the current state estimate to predict the next state of the system. This prediction is based on a mathematical model of the system's dynamics, which describes how the state evolves over time. The predicted state is accompanied by an estimate of the uncertainty (or error covariance) associated with the prediction.
Update Step: In this step, the Kalman Filter incorporates new measurements to update the state estimate. It calculates a weighted average of the predicted state and the new measurement, with weights determined by the respective uncertainties. The updated state estimate is more accurate because it takes into account both the prediction and the new information. The filter also updates the uncertainty estimate to reflect the reduced error after incorporating the new measurement.
Mathematically, the Kalman Filter can be represented by a set of equations that describe the state transition and measurement models, along with the associated uncertainties. These equations are applied iteratively, with each new measurement leading to a refined estimate of the system's state.
Kalman Filter in Trading
In the context of trading, the Kalman Filter can be used to estimate the underlying trend of a stock's price and filter out short-term noise. By doing so, it helps traders identify significant deviations from the trend, which can be used as trading signals. For example, if the stock's price deviates significantly below the estimated trend, it may indicate a buying opportunity, whereas a significant deviation above the trend may suggest a selling opportunity.
To implement a Kalman Filter-based trading strategy, we follow these steps:
Estimate the Moving Average: Use the Kalman Filter to estimate the moving average of the stock's price. This moving average represents the underlying trend, smoothed out from the noise.
Calculate the Z-Score: Compute the z-score, which measures how far the current price is from the estimated moving average in terms of standard deviations. The z-score helps identify significant deviations from the trend.
Generate Trading Signals: Define thresholds for entering and exiting positions based on the z-score. For instance, enter a long position when the z-score is below a certain threshold and exit when it reverts to a higher threshold. Similarly, enter a short position when the z-score is above a certain threshold and exit when it reverts to a lower threshold.
Implement Stop-Loss Mechanism: To manage risk, implement a stop-loss mechanism based on the price. This ensures that positions are closed if the price moves beyond a specified percentage from the entry price, limiting potential losses.
The Trading Strategy
The trading strategy we will implement uses the Kalman Filter to estimate the moving average of a stock's price. The strategy involves entering long or short positions based on the z-score, which measures how far the current price is from the estimated moving average. Additionally, we will implement a stop-loss mechanism based on the price to limit potential losses.
Strategy Rules:
Long Entry: Enter a long position when the z-score is below a certain threshold.
Short Entry: Enter a short position when the z-score is above a certain threshold.
Exit Long: Exit a long position when the z-score reverts to a higher threshold.
Exit Short: Exit a short position when the z-score reverts to a lower threshold.
Stop-Loss: Exit the position if the price moves beyond a specified percentage from the entry price.
Evolution of the Strategy
Developing a robust trading strategy involves multiple iterations, testing, and refinements. Here's a brief overview of how we arrived at our current Kalman Filter-based strategy:
Initial Concept: The initial concept involved using the Kalman Filter to smooth out stock price data and generate trading signals based on deviations from the estimated moving average. We started with basic entry and exit rules based on the z-score.
Adding Stop-Loss: To manage risk, we introduced a stop-loss mechanism based on the z-score. However, this approach had limitations, especially in volatile markets where the z-score could fluctuate widely.
Optimizing Parameters: We explored different thresholds for entry, exit, and stop-loss to optimize the strategy's performance. This involved extensive backtesting and parameter tuning.
Price-Based Stop-Loss: To improve the strategy's robustness, we shifted to a price-based stop-loss mechanism. This change provided a more intuitive and effective way to limit potential losses.
Final Refinements: After several rounds of testing and refinements, we arrived at the current version of the strategy, which balances entry and exit rules with an effective stop-loss mechanism.
Results
After implementing and optimizing the Kalman Filter-based trading strategy, let's evaluate its performance using historical data for Apple Inc. (AAPL). The results show the best thresholds and the performance metrics of the strategy.
Best Thresholds:
Long Entry Threshold: -3
Short Entry Threshold: 3
Long Exit Threshold: 0.25
Short Exit Threshold: -0.5
Stop-Loss Threshold: 0.02
Performance Metrics:
Best Sharpe Ratio: 0.6404972725290812
Optimized Sharpe Ratio: 0.6404972725290812
Optimized Max Drawdown: 0.1802083236506904
The strategy demonstrates a reasonable Sharpe Ratio of 0.6405, indicating a balance between risk and return. The maximum drawdown of approximately 18% suggests that the strategy can withstand market downturns to a certain extent. However, it is essential to continue refining the strategy and testing it under different market conditions to ensure its robustness and adaptability.
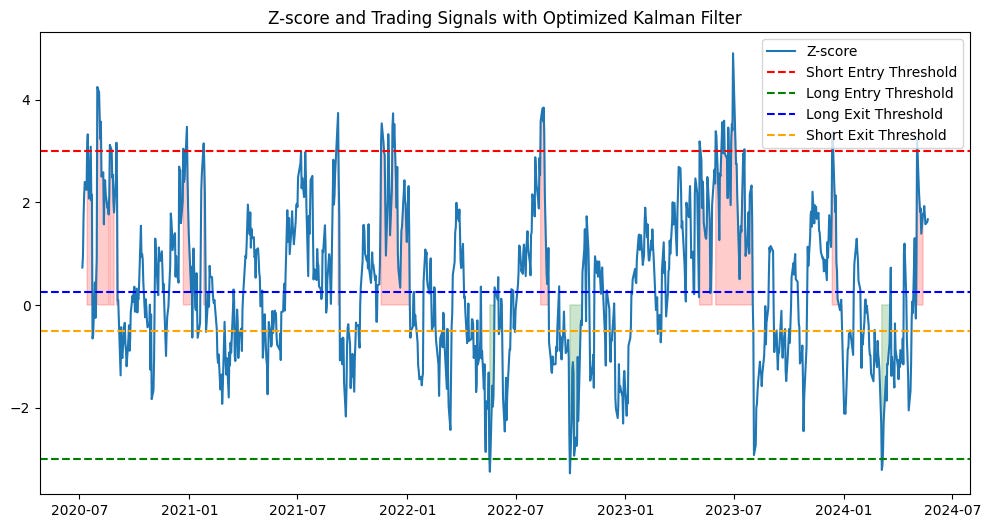
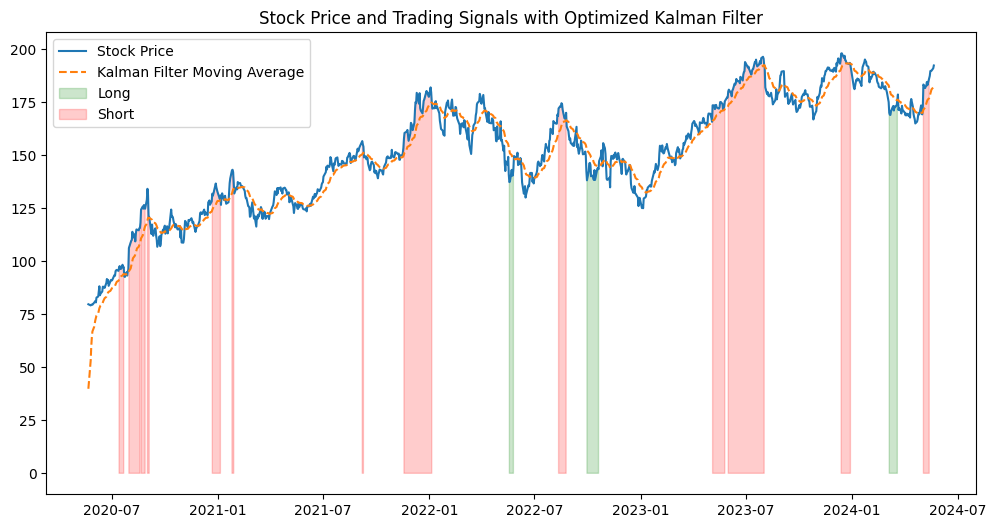

The cumulative returns plot shows the performance of the strategy over the backtesting period. The trading signals plot illustrates the stock price, the Kalman Filter moving average, and the long and short positions taken by the strategy. The z-score plot highlights the entry and exit points based on the optimized thresholds.
Implementing the Kalman Filter Trading Strategy in Python
Let's walk through the implementation of the Kalman Filter trading strategy in Python. We'll use the yfinance library to fetch stock data, pykalman for the Kalman Filter, and pandas for data manipulation.
Keep reading with a 7-day free trial
Subscribe to Quantitative Finance Insights to keep reading this post and get 7 days of free access to the full post archives.